

Using Art to Answer Questions
My name is Bailey Gallinger. I am a fourth-year student in Recreation and Leisure Studies at Brock University. I recently completed a placement with the Young Caregivers Association, an organization that strives to decrease isolation and stress, and increase resiliency and wellbeing among individuals aged 5 to 13 in young caregiving roles. This blog will offer a first-hand account on my experiences and successes while carrying out a program evaluation in practice with my placement organization.
When thinking about how to go about evaluating an organization, a group of people, or even just one individual, what is the first thing that comes to mind related to gathering information? Personally, I think of:
- Doing an interview
- Hosting a focus group
- Making a questionnaire
- Sending out a quick survey
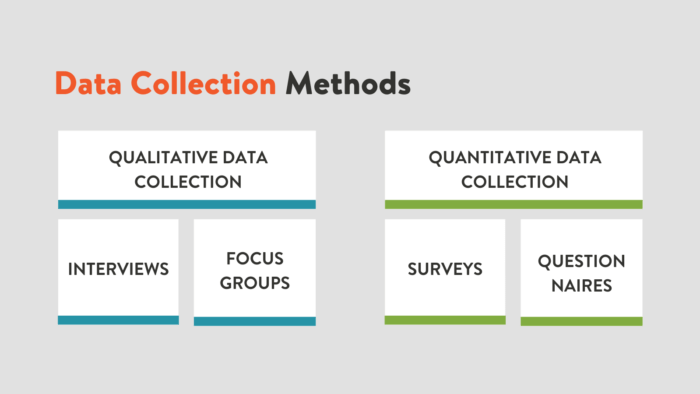
These are, of course, just a few of the many, many ways in which we can collect data. But why and how are these methods useful towards doing a program evaluation? First, it is important to distinguish the purpose of the data collection method that is chosen. There are two overarching approaches that can be chosen and used to assess data, including: quantitative and qualitative.
How do these two approaches to data collection differ and what makes them unique? According to Queirós, Faria, and Almeida (2017), quantitative research helps us to find answers to our research questions quickly, while qualitative research methods help us to understand the meaning behind the answers given to our research questions, and involves more of an in-depth process.
We can further differentiate between quantitative and qualitative research approaches by the data collection tools (discussed above) that they draw upon, including:
Selecting Our Data Collection Tools
While working on my program evaluation with the Young Caregivers Association and deciding on the best data collection approach with my partner, we set out to ask our child and youth participants (aged 5-13) three key questions: “Do you feel less alone by coming to program?”, “Does coming to the program help you feel calm?” And “Do you enjoy playing the active activities during program?” But we also wanted to go beyond the standard survey or traditional data collection methods highlighted above in order to effectively engage our young participants in our evaluation – ensuring that it was something that they wanted to participate in, not something that they felt was a task or chore. This inspired us to create an arts-based data collection activity. An arts-based activity – such as one that uses drawing or poetry, is an approach to data collection in which researchers draw upon different artistic forms and expressions to gain individualized insights from participants. Simons & McCormack (2007) assert that obtaining data via arts-based activities or methods helps participants better express themselves and make connections on a topic that may not be able to communicate in a standard survey or interview.
Overall, my partner and I felt that an arts-based activity would be an effective choice for data collection as our participants were quite young (5-13 years) and we noticed that they loved the arts and craft-based activities offered by the organization in their weekly virtual programming.
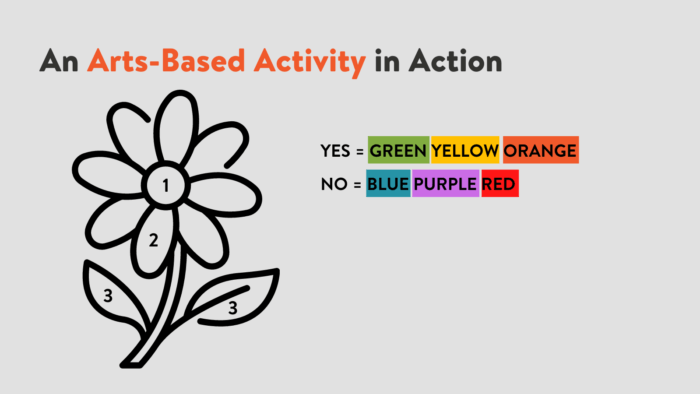
An Arts-Based Activity in Action
In creating our arts-based activity, we had an idea to use a “colour by number” activity, which asked participants to answer our three evaluation questions by colouring each section of a diagram with a colour corresponding to their answer. To illustrate further – let’s say that we wanted to use a picture of a flower for our colour-by-number activity, which includes a center, petals and a stem. We would first instruct participants that the center of the flower represents Question 1 – “I feel less alone as a caregiver”, the petals represent Question 2 – “Does coming to program help you to feel more calm?”, and that the stem of the flower represents Question 3 – “Did you have fun playing active games during program?”. We would then tell the children that the colours green, yellow, and orange represent a “yes” response, and that the colours blue, purple, and red all represent a “no”. Ultimately, the participants were asked to colour in the picture with the colour that corresponded with their answers to each of the 3 evaluation questions. For a better representation, see the example below!
To facilitate our colour-by-numbers activity in practice, we first had the program staff at Young Caregivers print out our evaluation tool and drop it off at each participants’ houses along with other activities and handouts that were meant to complement virtual programming held during COVID-19. On a pre-determined date, we facilitated our activity over Zoom during regular program time, walking program facilitators through how to fill out the evaluation with the participants in their session. We then had the participants hold up their completed pictures to the camera and took screenshots of the screen so that we could analyze participants’ answers at a later time. In total, we had 9 participants complete the evaluation from one program session, and 6 complete the evaluation from a second, all between the age of 5-13 years.
Next Steps…
To date, my partner and I have done one round colour-by-numbers using this data-collection approach, using a picture of a snowman which related to the winter, as that is when the first round of data was collected towards our evaluation. We are looking forward to implementing our tool again with an image of a frog, an umbrella and a cloud – as a way to represent the spring through these images, and are eager to view any shifts or changes in participants’ responses!
Following this, our next steps are to interpret our findings from our first and second round of the evaluation, comparing the results of each to see any changes that may have occurred between time one and time two. We will use our findings from this evaluation to inform the Young Caregivers Association if their Caregivers Night Out program is meeting their identified program goals of decreasing isolation and stress, and increasing resiliency and wellbeing among individuals aged 5 to 13 in young caregiving roles.
Overall, we found success using this arts-based data collection approach to our program evaluation, as each participating child’s picture was unique to them with the colours and answers that they chose, and enabled us to collect data for our evaluation from young children – ensuring their voices and experiences in the program were captured. We encourage other organizations working with younger participants to get creative and explore other types of arts-based data collection methods that they could use to evaluate their programming!